Will Bitcoin Bounce After US Shutdown? And What’s Next for Ethereum as L2 Scaling Accelerates?
Bitcoin and Ether slid as risk appetite thinned, with ETF outflows and mixed macro signals keeping traders defensive.
Over the past 24 hours, Bitcoin (BTC) traded near $102,757, down approximately 1.1%, while Ethereum (ETH) hovered around $3,358, off roughly 4.2%.
Market Cap
Bitcoin Price Prediction: Will Bitcoin Rebound After the US Government Shutdown Ends?
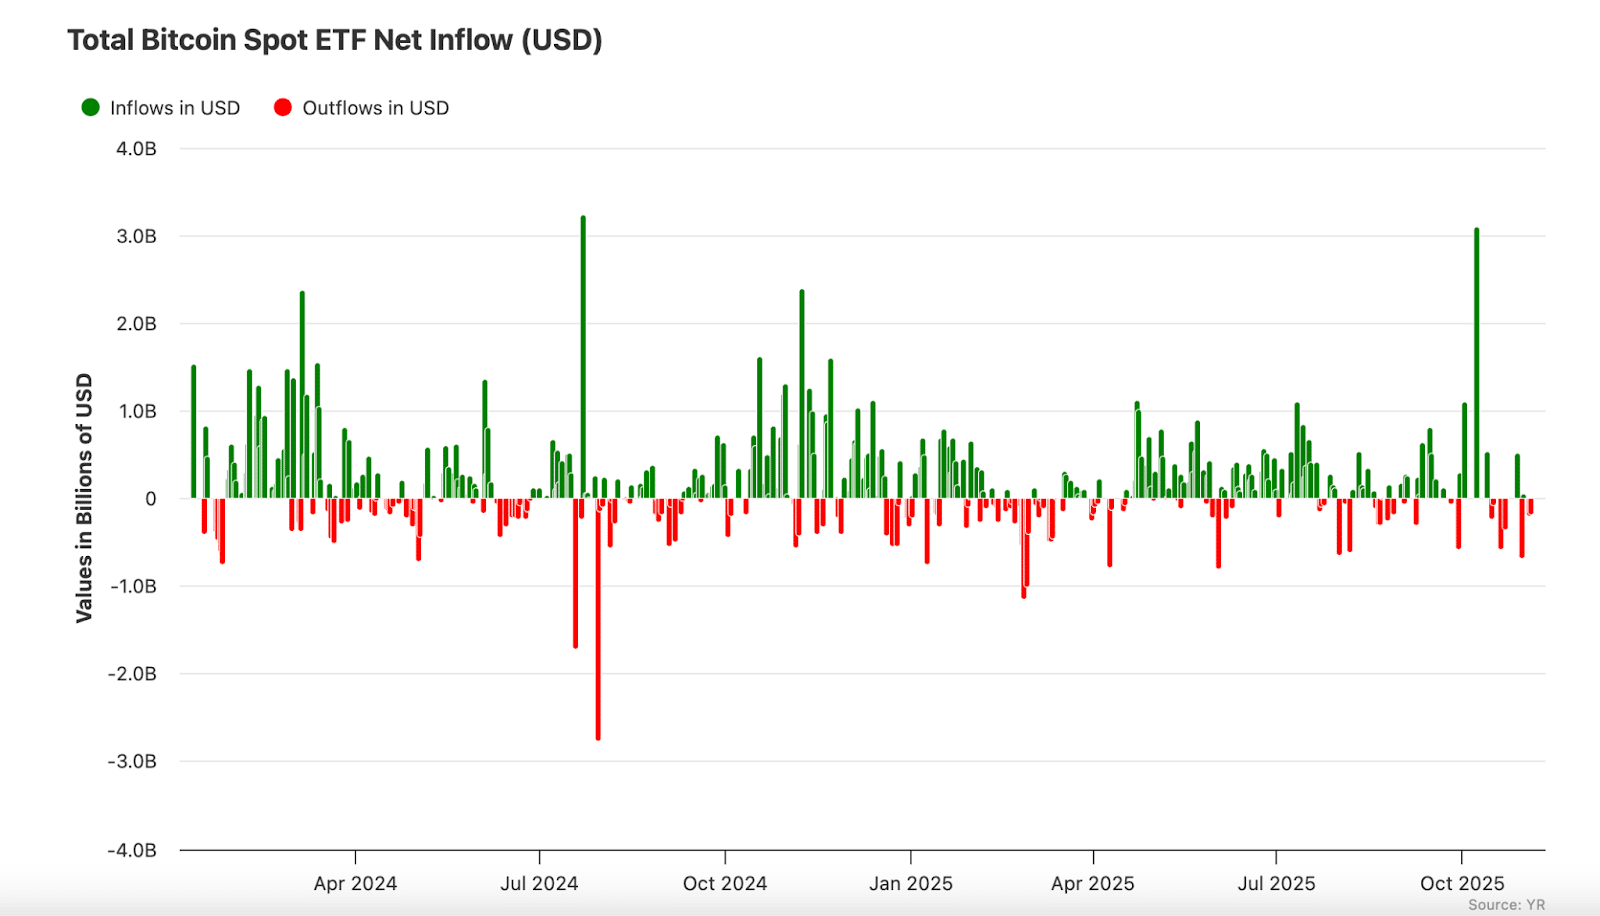
US-listed Bitcoin ETFs have seen fresh net outflows in recent days. At the same time, new private-payrolls data added uncertainty to the broader economic outlook, weighing on global markets.
()
The latest showed US private payrolls rising by 42,000 in October.
The figure came in slightly better than expected, but with most government data on hold during the federal shutdown, the report did not ease market concerns.
Reuters pressure across US futures and major tech benchmarks in Asia.
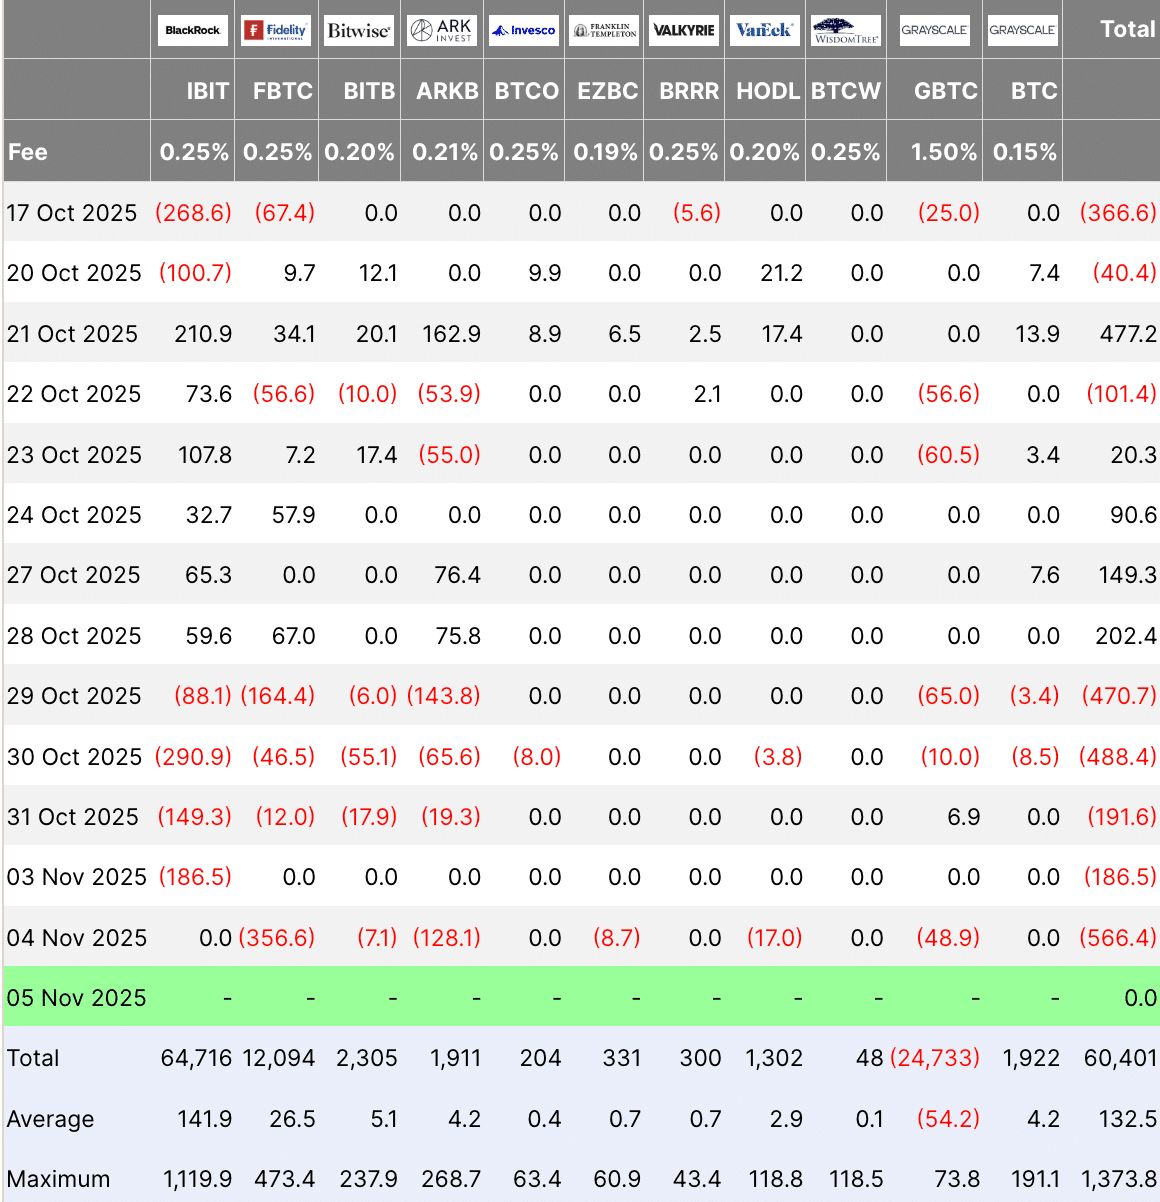
ETF flow trackers net outflows between October 31 and November 4, indicating softer interest after strong inflows earlier this year.
The daily numbers vary, but the trend has leaned negative, adding to the cautious mood around Bitcoin.
()
Policy signals were mixed. Additionally, industry groups in Japan desire more favorable regulation, which would be beneficial to trading activity.
In the UK, financial technology companies called on regulators to accelerate the policy-making process on crypto, saying that the US, EU, and Singapore have acted quickly.
The shutdown in Washington has left US agencies stretched, slowing progress.
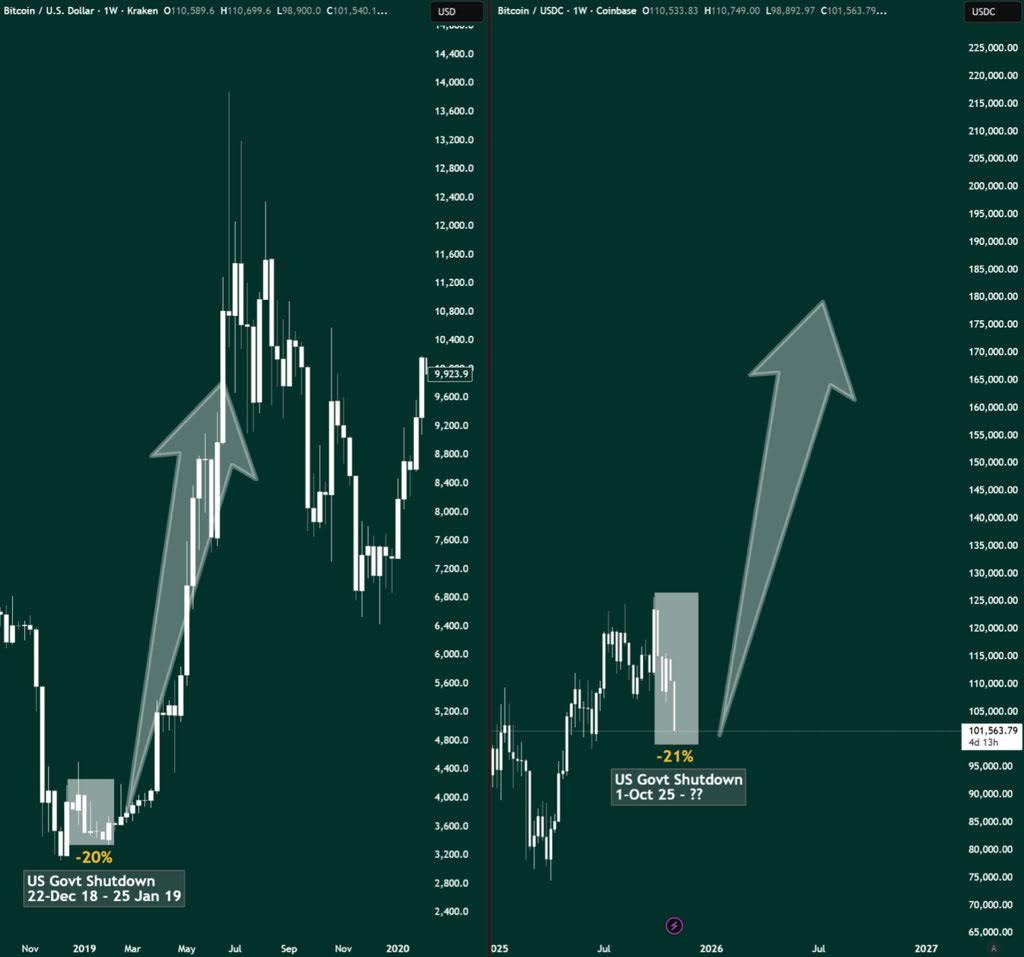
Bitcoin is trading near $101,000. Analyst Gordon linked its next move to the shutdown, pointing to a similar period in late 2018.
()
Then, Bitcoin dropped about -20% during the shutdown but gained nearly +50% over the next three months.
The chart shows a pullback of about 21% into support. A large upward arrow hints at a possible rebound once the US government shutdown ends.
Recent candles are moving sideways, which suggests selling is slowing.
Gordon says that if past patterns return, short sellers may face pressure, as the chart leaves room for a sharp recovery.
DISCOVER:
Ethereum Price Prediction: What Does GrowThePie Data Reveal About Ethereum’s Current TPS?
Market Cap
Ethereum’s layer-2 (L2) networks are growing fast and helping the chain scale.
Data from GrowThePie suggests Ethereum could handle up to 10,000 transactions per second (TPS) by 2031 as more L2 systems go live.
Ethereum’s L2s are exploding in activity, and L1 is next.
Mainnet is expected to scale from 18.6 TPS today to over 10,000 TPS by 2031.
A 500x+ increase in capacity.
This growth will come from upgrades like Danksharding, data availability sampling, and execution…
— Leon Waidmann (@LeonWaidmann)
The analytics firm states that the Ethereum Mainnet processed approximately 18.6 TPS last month. To reach the 10,000 TPS goal, the network would need to grow roughly 537 times from its current level.
For context, Ethereum has increased from approximately 0.71 TPS in 2015 to 18.6 TPS today, representing a nearly 26-fold increase.
From May to November 2025, it processed 3.56 million transactions, logged 242,780 active wallets, held $7.91 billion in stablecoins, and secured $16.34 billion in total value.
Arbitrum One generated approximately $363,700 in revenue during the period and reported a profit of roughly $361,000 on-chain.
Ethereum pulled back sharply this week, trading near $3,360. The drop returns it to the same price zone that defined most of 2024.
Has fully rejected from that previous cycle high and is now back in that $2.8K-$4.1K range which it traded around for most of 2024.
Technically, the weekly structure still fine where the daily is obviously now trending down.
Good chance this goes back to chopping around…
— Daan Crypto Trades (@DaanCrypto)
Market analyst Daan Crypto said on X that ETH “fully rejected” its previous cycle high and has returned to the $2,800–$4,100 range.
The weekly chart indicates that the asset is losing strength after failing to maintain gains near the $4,864 resistance level. That ceiling has rejected price more than once in earlier cycles.
Daan said the broader weekly structure still looks stable, though the daily trend has shifted lower.
He expects a period of sideways action and noted that price may “chop around for a while” before another strong move.
Key support remains near $2,850, with a deeper floor visible near $2,200–$2,160. A break below the midpoint zone could expose those levels, while a recovery above $4,100 would be needed to regain bullish control in the longer term.

 (@LeonWaidmann)