Capriole Founder Not Bearish On Bitcoin Despite Headwinds—Here’s Why
The founder of Capriole Investments says he “cannot be bearish” on Bitcoin, pointing to key indicators that remain inside green territories.
Bitcoin Heater & NVT Are Both Inside Bullish Zones
In a new on X, Capriole Investments founder Charles Edwards has shared a couple of indicators related to Bitcoin that could paint a picture different than what the crowd is thinking right now.
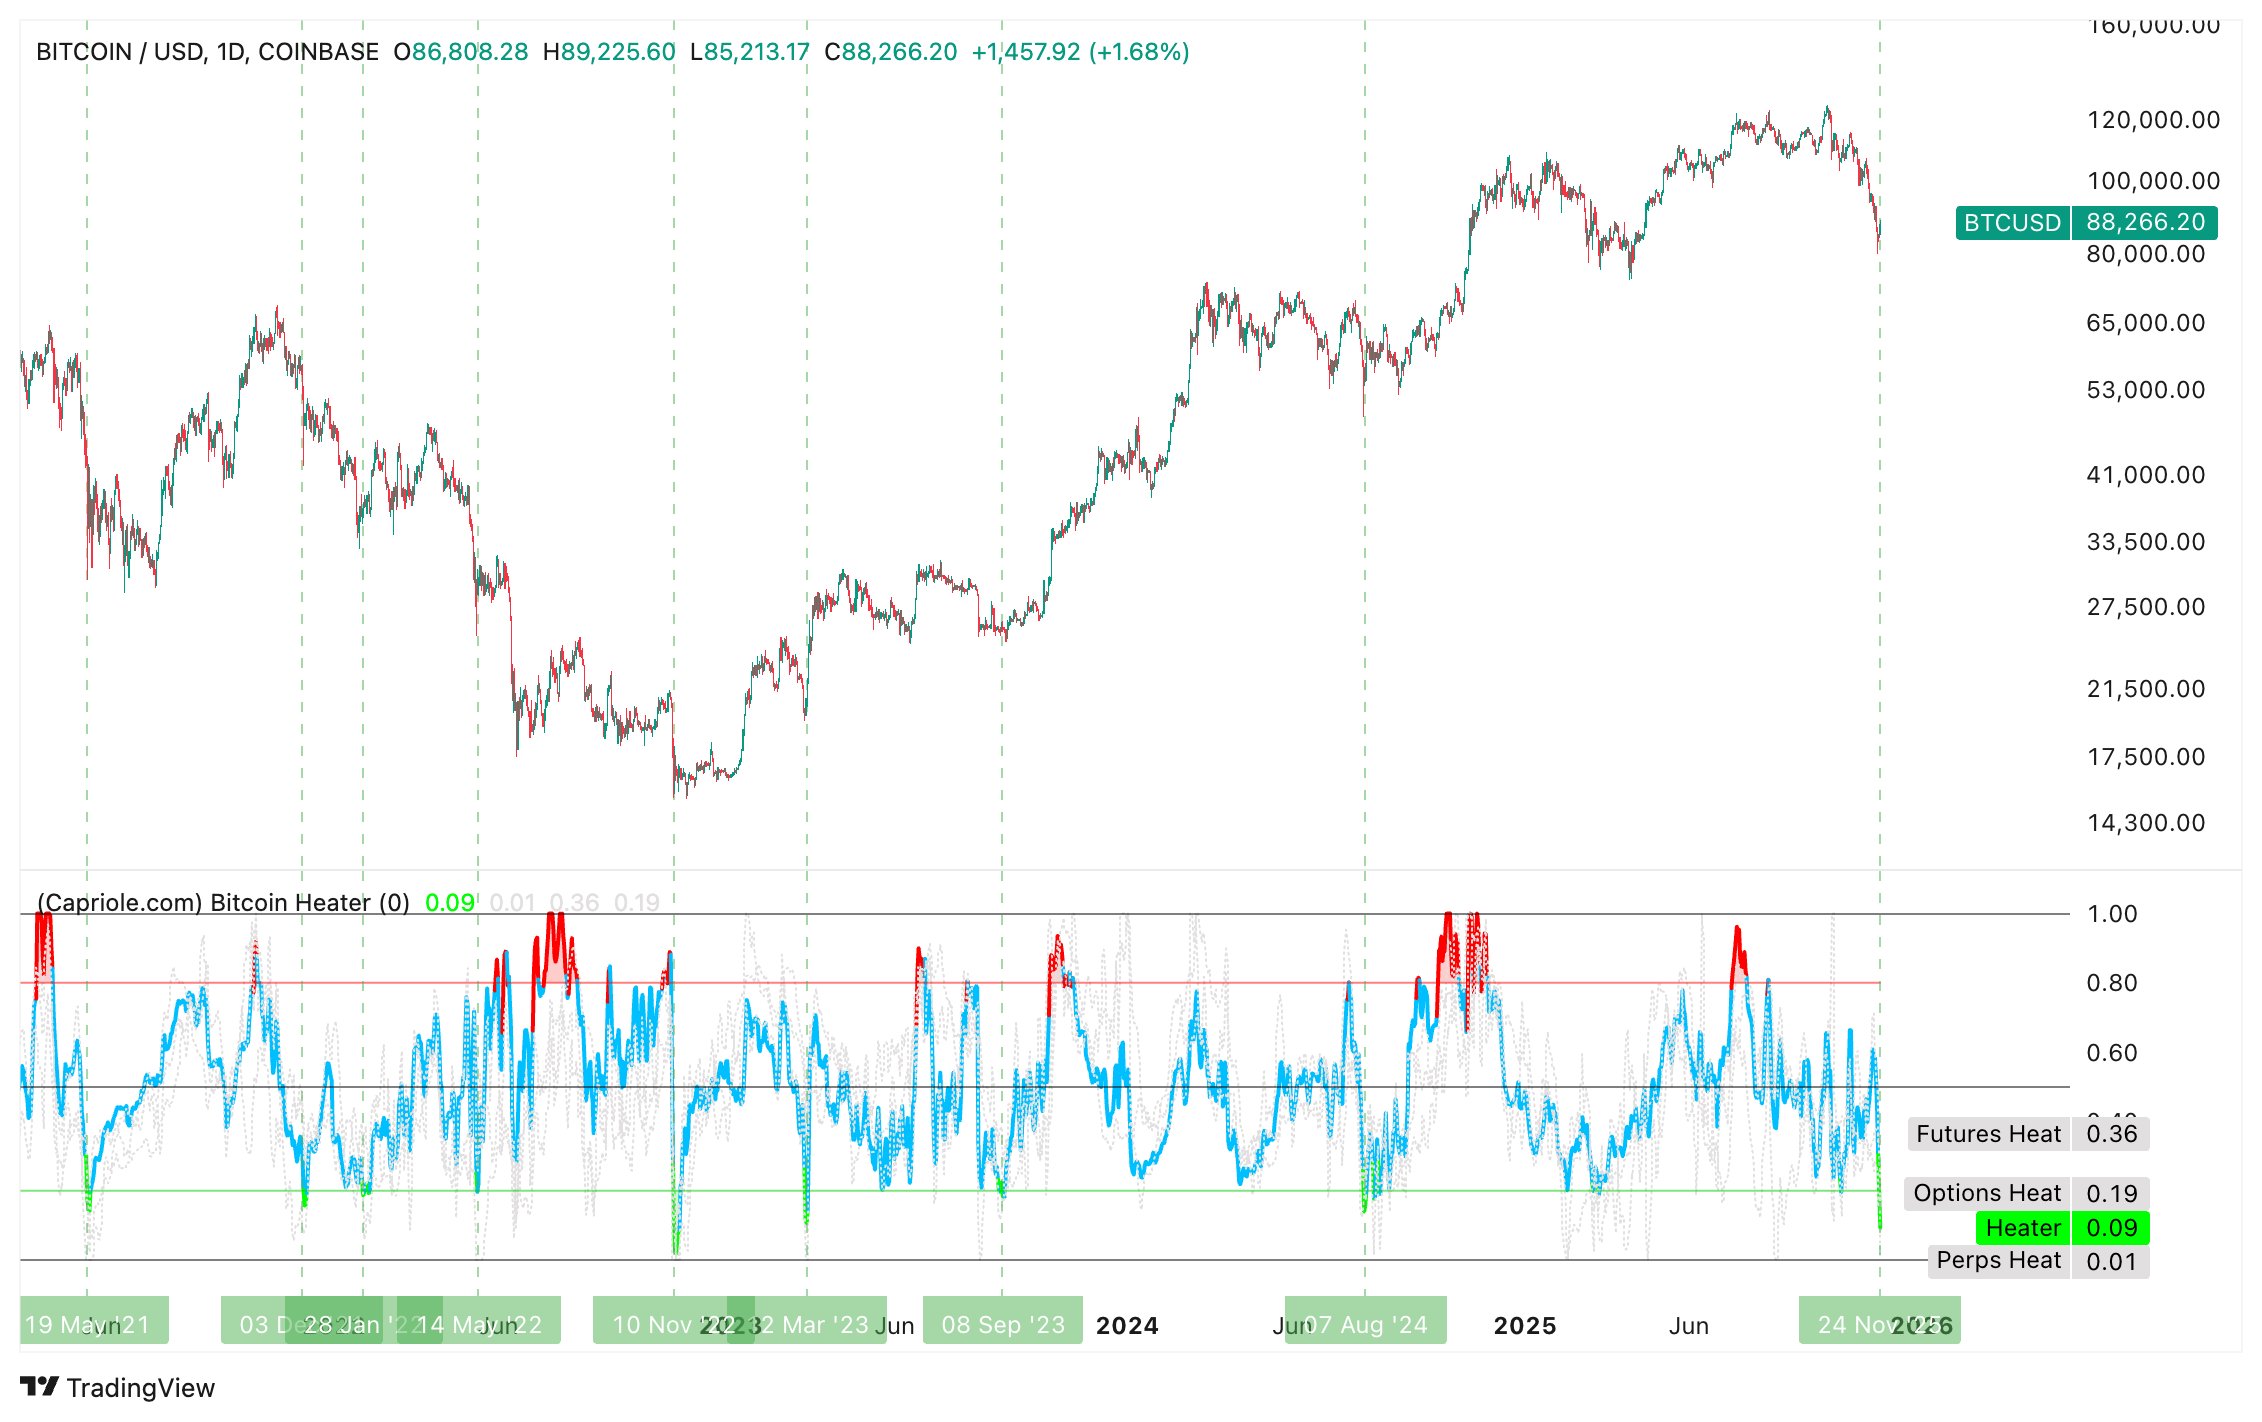
The first indicator is Capriole’s “Heater,” gauging the situation related to the market. The metric tracks the data associated with the entire sector, including perpetual swaps, futures, and options markets.
When this indicator has a high value, it’s a sign that investors are using high leverage and have an extreme level of bullish positioning across the various derivatives markets.
Now, here is the chart for the metric shared by Edwards that shows the trend in its value over the last few years:
As is visible in the above graph, the Heater has witnessed a plunge recently as the Bitcoin price has crashed, indicating a cooldown in sentiment on the different derivatives markets.
The metric is now inside the green zone, which has historically facilitated at least local bottom formations for the cryptocurrency. The same signal also emerged alongside the bottom back in November 2022.
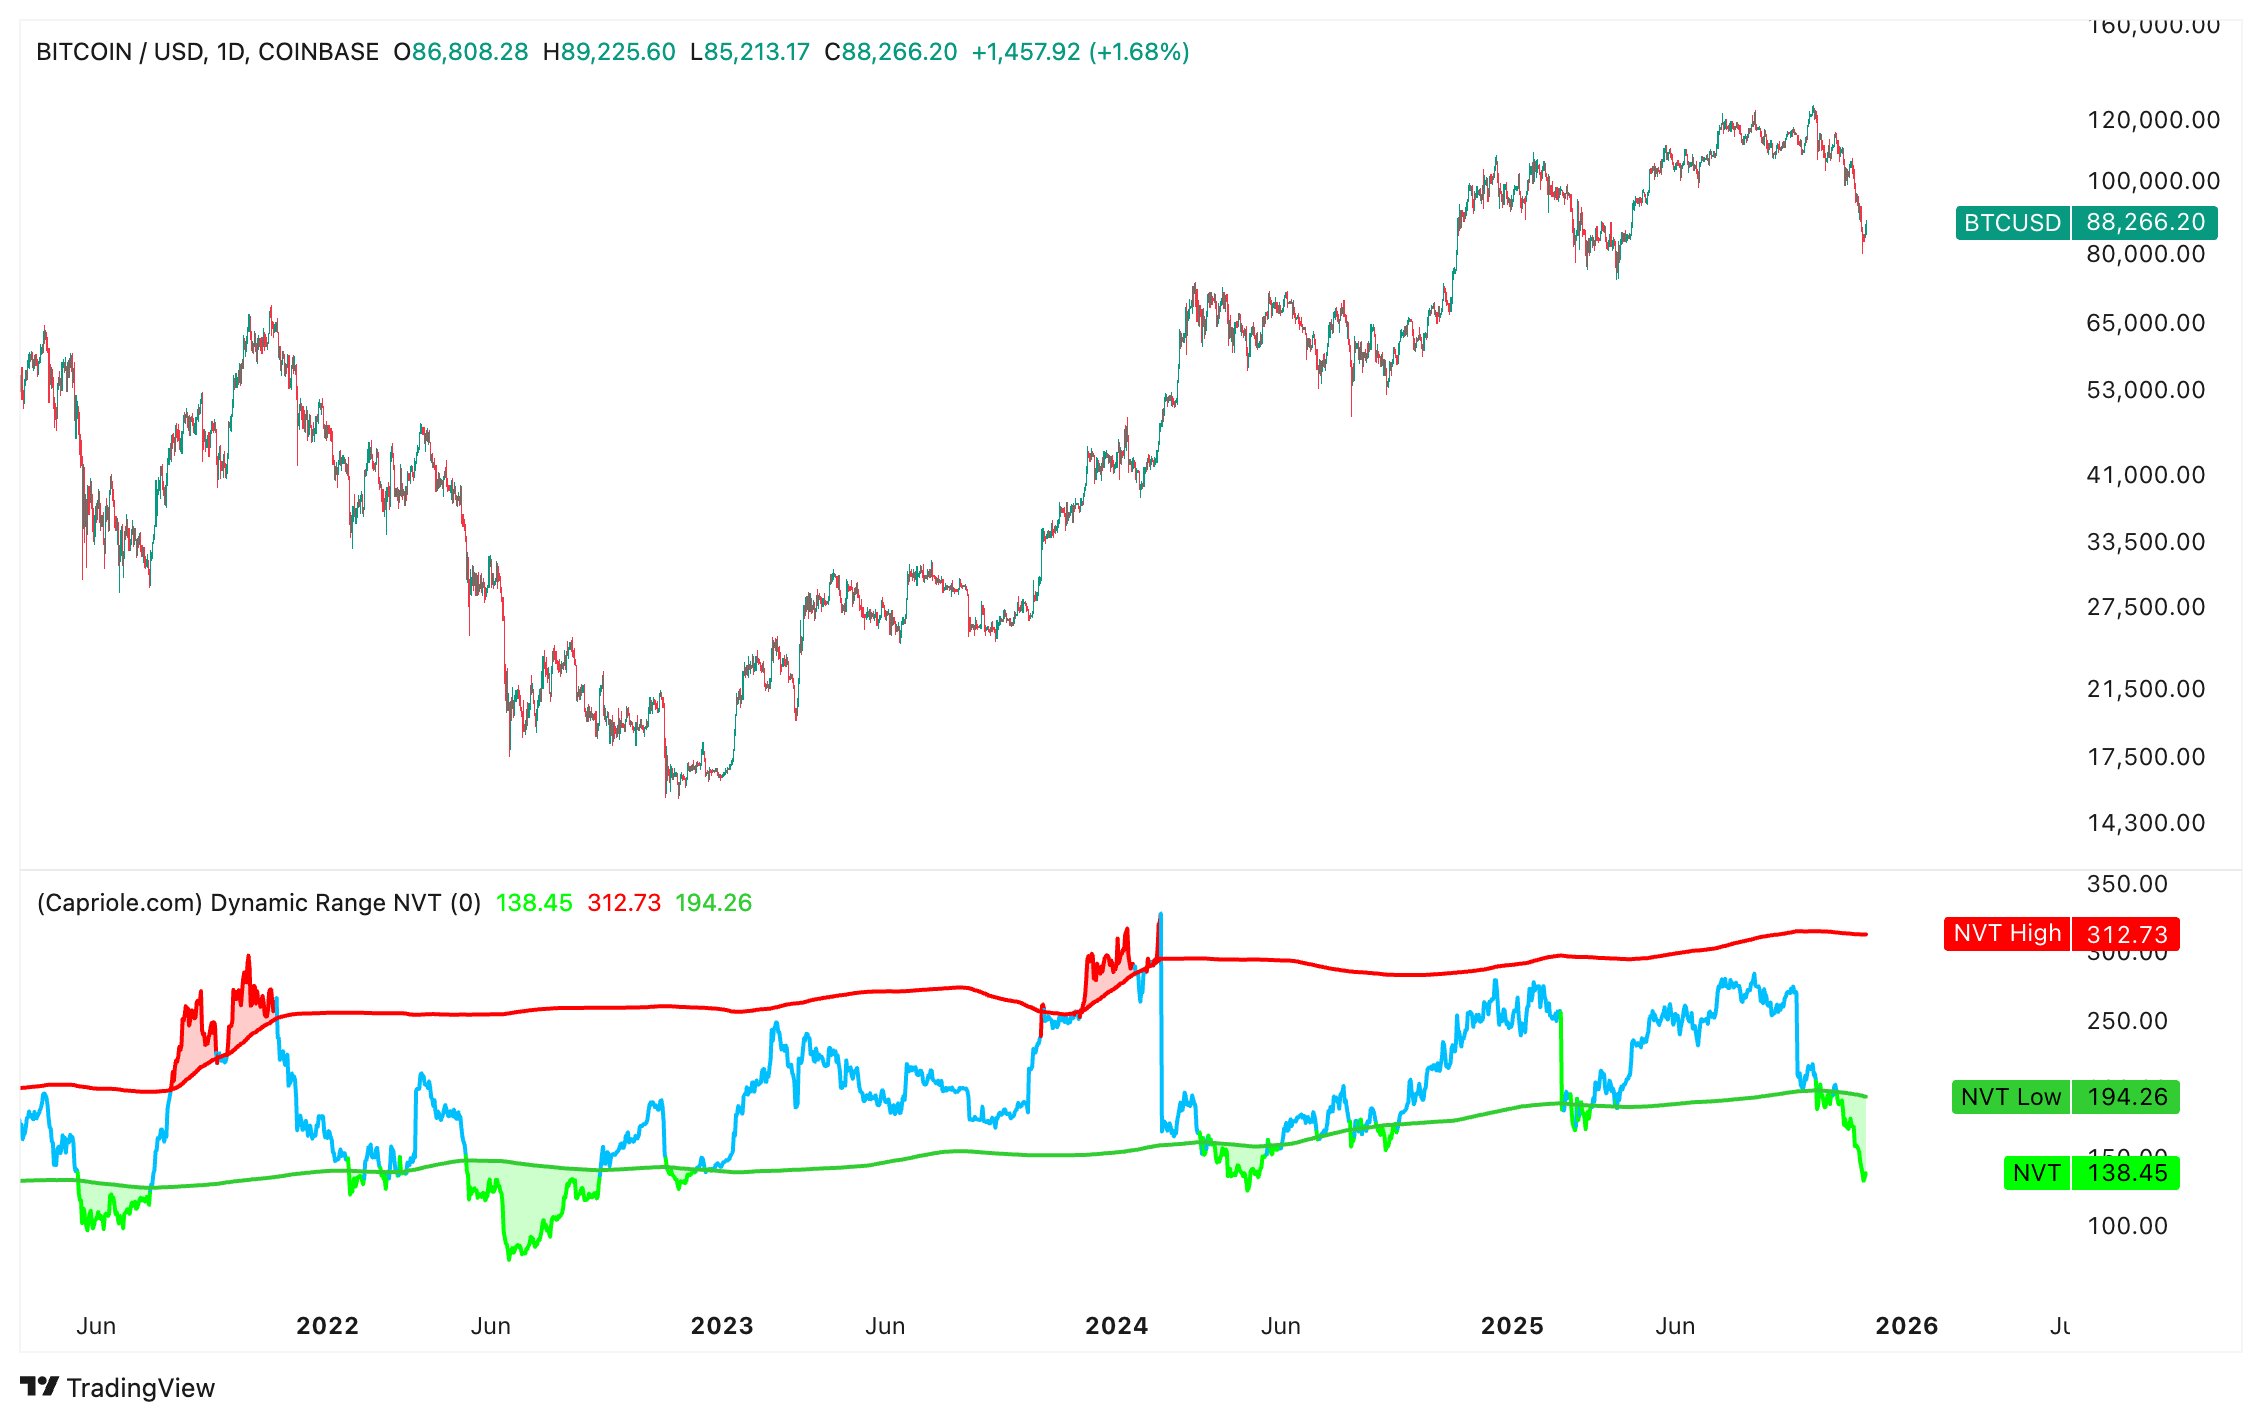
The other indicator that’s bullish on Bitcoin right now is the Dynamic Range NVT. The is a popular BTC metric that’s used for measuring whether the asset’s value (that is, the market cap) is fair compared to the network’s ability to transact coins (the transaction volume).
When this metric has a high value, it means that the market cap is high relative to the transaction volume. Such a trend could be a sign that a correction may be due for the coin.
On the other hand, a low value on the metric can suggest the cryptocurrency’s value may not be inflated relative to its volume, and thus, could potentially have room to grow.
Capriole’s Dynamic Range NVT defines lower and upper bands for the metric, beyond which the asset may be considered underbought and overbought, respectively. As the metric’s name suggests, these bands are dynamic, meaning that they change with time and reflect the recent Bitcoin environment.
From the above chart, it’s apparent that the Bitcoin NVT Ratio has declined below its lower band recently, implying the coin may be undervalued. The last time this signal appeared was during the bearish period earlier in the year.
“We have some big headwinds to resolve (like institutional selling), but I cannot be bearish with Heater in the deep green zone today + fundamental value across the board,” said Edwards. The analyst suspects BTC might climb higher for at least the coming week.
BTC Price
At the time of writing, Bitcoin is floating around $87,000, down over 7% in the last seven days.