Ethereum Price To $12,000? ETH Could Repeat This Bitcoin 2020 Fractal
With the in the cryptocurrency market, the large-cap altcoins have been some of the major beneficiaries of the current positive trend. Ethereum price, specifically, has continued to impress, with the second-largest cryptocurrency reasserting its position in the market over the past weeks.
The Ethereum price displayed significant bullish impetus going into the weekend, reclaiming the $4,000 mark for the first time since December 2024. Interestingly, the “king of altcoins” appears to only be at the beginning of an extended upward trajectory.
ETH Price To Soar By 182% In The Coming Months: Analyst
In an August 9 post on the social media platform X, pseudonymous crypto analyst Titan of Crypto an exciting layout for Ethereum that could see its price climb as high as $12,000. This positive projection is based on the price fractals of the world’s largest cryptocurrency by market capitalization, Bitcoin, in 2020.
In technical analysis, fractals refer to the recurring patterns on a price chart. These price patterns often offer insight into historical price movements and can be used to analyze the future trajectory of a cryptocurrency.
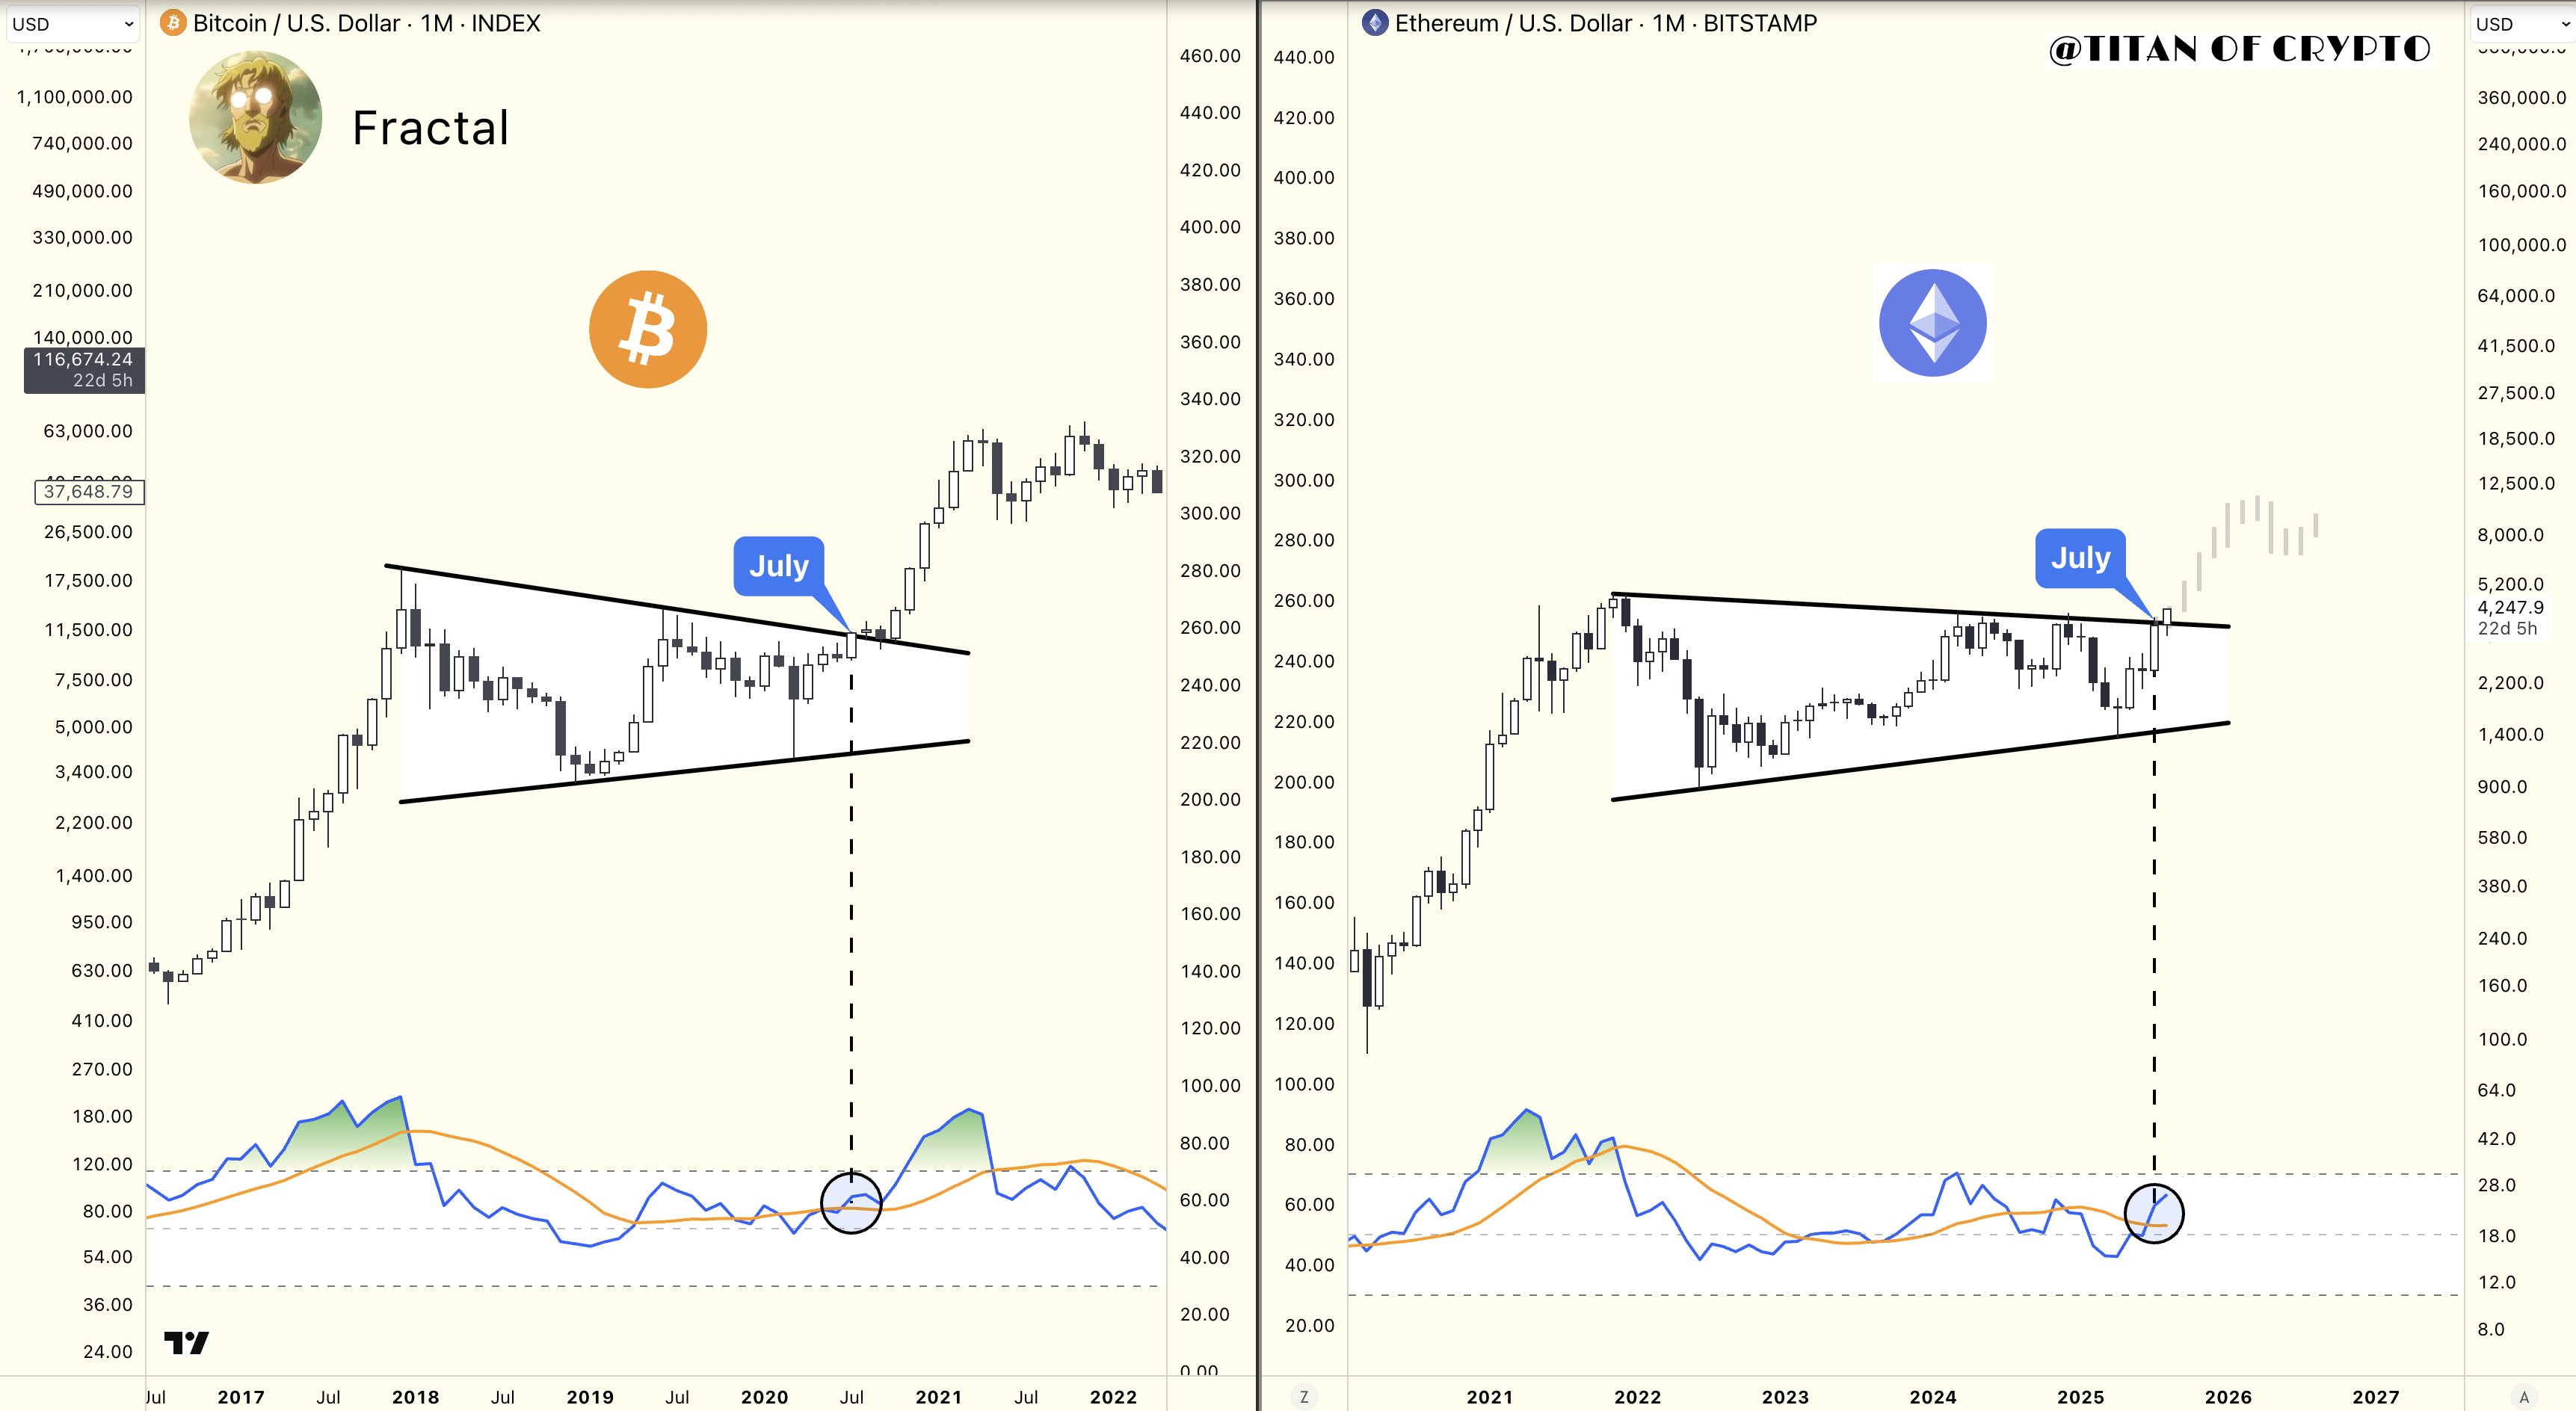
Titan of Crypto revealed that the Ethereum price is currently at the same spot that the price of BTC was in August 2020. At the time, the premier cryptocurrency was trading within a converging wedge pattern before at around $69,000.
As shown in the chart above, the Ethereum price is currently trading within a similar converging wedge pattern on the monthly chart. Both BTC and off the lower boundary of the chart pattern earlier in 2020 and 2025, respectively.
Almost identically, the two largest cryptocurrencies almost broke above the trendline with their respective July 2020 and 2025 candlestick. While the price of BTC hovered around the upper trendline in the subsequent two months, the Ethereum price has broken clearly above the wedge pattern with its August candlestick.
If history is anything to go by, and a sustained monthly close above $4,000 occurs, the price of Ethereum could be on its way to an unprecedented high around the $12,000 region. This move represents a potential 182% from its current price point.
Ethereum Price At A Glance
As of this writing, the Ethereum token is valued at around $4,270, reflecting an almost 6% increase in the past 24 hours. According to data from CoinGecko, the altcoin is up by more than 25% in the past seven days.