Is The Bitcoin Top In? Bitcoin MVRV-Score Has The Answer
Bitcoin is $110,000 again, recently pushing to an intraday high of $108,116 and now steadily trading above $107,000. Despite the retracement below $99,000 in the past week, Bitcoin’s current price action shows that the
Notably, the recent price action in the past 24 hours is beginning whether Bitcoin has already reached its top for this cycle. The MVRV Z-Score may be offering a clear answer, and it points in a very different direction from what some might expect.
MVRV Z-Score Says Bitcoin Has Room To Run
According to crypto analyst Doctor Profit, who initially posted Bitcoin on the social media platform X, the MVRV Z-Score indicates that BTC is still far from its cycle top. The MVRV Z-Score is an established on-chain metric used to determine whether Bitcoin is overvalued or undervalued.
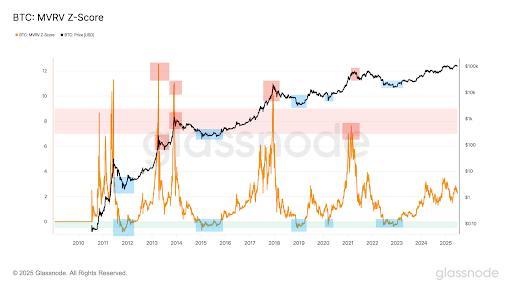
As pointed out by the analyst, the current level is only slightly above 2, which has been a relatively neutral zone since Bitcoin’s creation. Bitcoin only reached its major tops in past cycles when this metric climbed into the red zone and above a value of around 8 and above.
The overall Bitcoin price chart shared by Doctor Profit supports this claim. Peaks in the orange MVRV Z-Score line are shown with red shaded zones in the chart below. These red zones have aligned almost perfectly with Bitcoin’s price tops in 2011, 2013, 2017, and 2021. On the other hand, despite the recent surge to new all-time highs in May, the current cycle has that overheated region. Instead, the chart shows the Z-Score still in a much lower band. This boils down to show that the Bitcoin price could have a very significant upside left.
MVRV vs Price: What The Current Setup Means For Bitcoin
One detail that stands out in the current cycle is the pattern of lower highs forming in the MVRV Z-Score, as seen in the chart. Unlike in old cycles, where the metric surged into extreme overvaluation zones above 10, the most recent peaks have been noticeably more subdued. This trend could be interpreted as a signal that the market is beginning to mature or that Bitcoin may even already beof its current cycle.
However, although this pattern is worth keeping an eye on, it is far from conclusive. The only conclusive fact is that Bitcoin’s price has never reached a definitive cycle top until the MVRV Z-Score has pushed into the red zone, which it has yet to do this time around. Although there isn’t a set price peak from the metric, other analysts have offered a wide range of predictions for where it might land. Predictions of anywhere from $150,000 to as high as $500,000.
At the time of writing, Bitcoin is trading at $107,740, up by 1.4% in the past 24 hours.