Bitcoin and Ethereum Prediction: Will BTC’s Liquidity Range and ETH’s Rising Open Interest Trigger the Next Market Shift?
Bitcoin and Ethereum are holding steady near important levels while derivatives traders prepare for the next move. According to on December 7, Bitcoin price is trading just below $89,400 today. The price is up about +0.1% in the past 24 hours, with roughly $28.5Bn in spot volume.
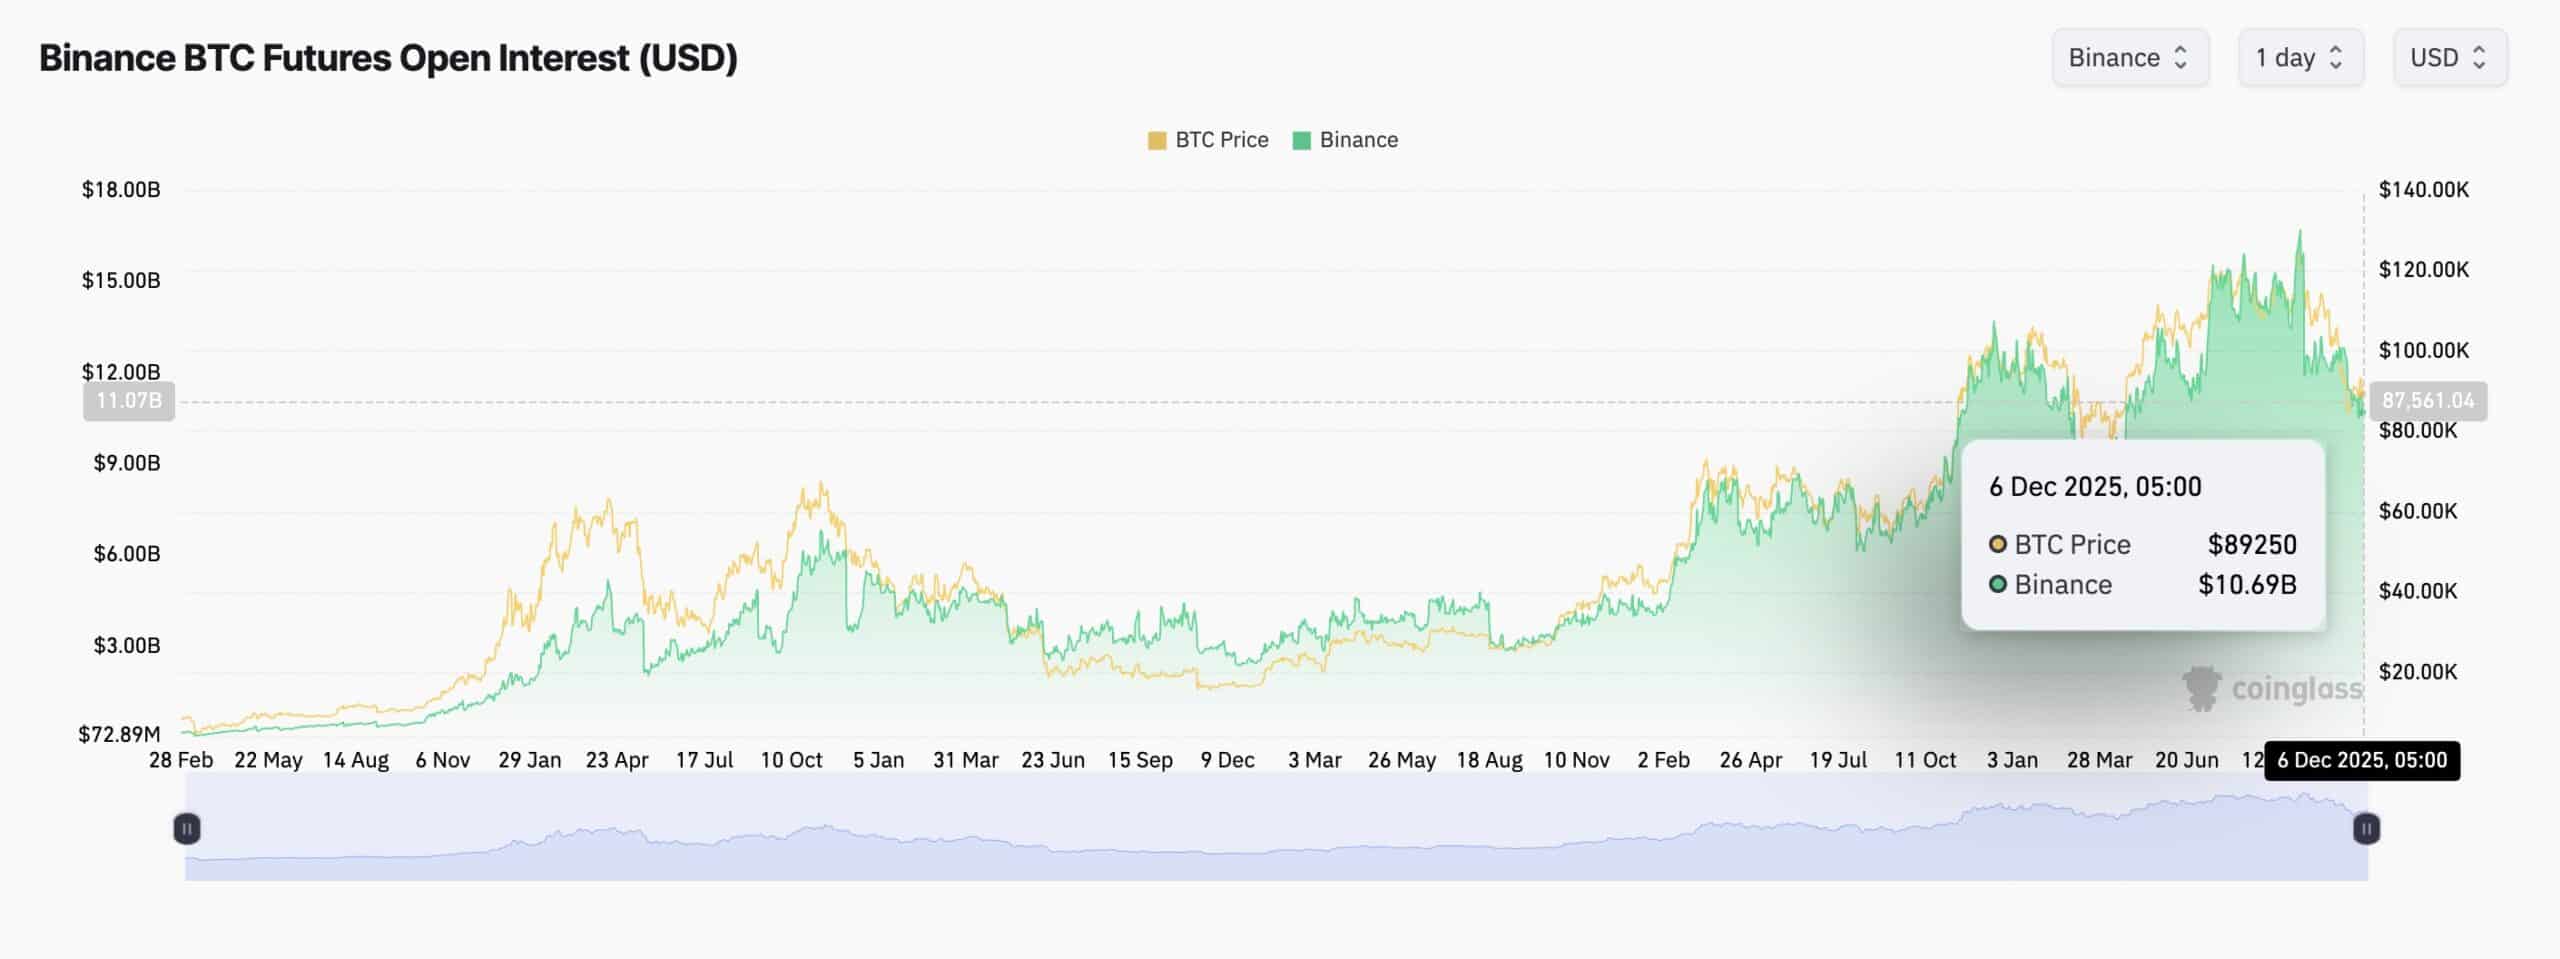
The calm spot trading hides a much busier picture in the futures market. CoinGlass Bitcoin futures open interest sitting near $56.5Bn.
Futures volume over the past day is close to $49.5Bn, while spot volume on major exchanges is around $3.6Bn.
DISCOVER:
Is Bitcoin’s On-Chain Activity Enough to Support a Move Toward $100K?
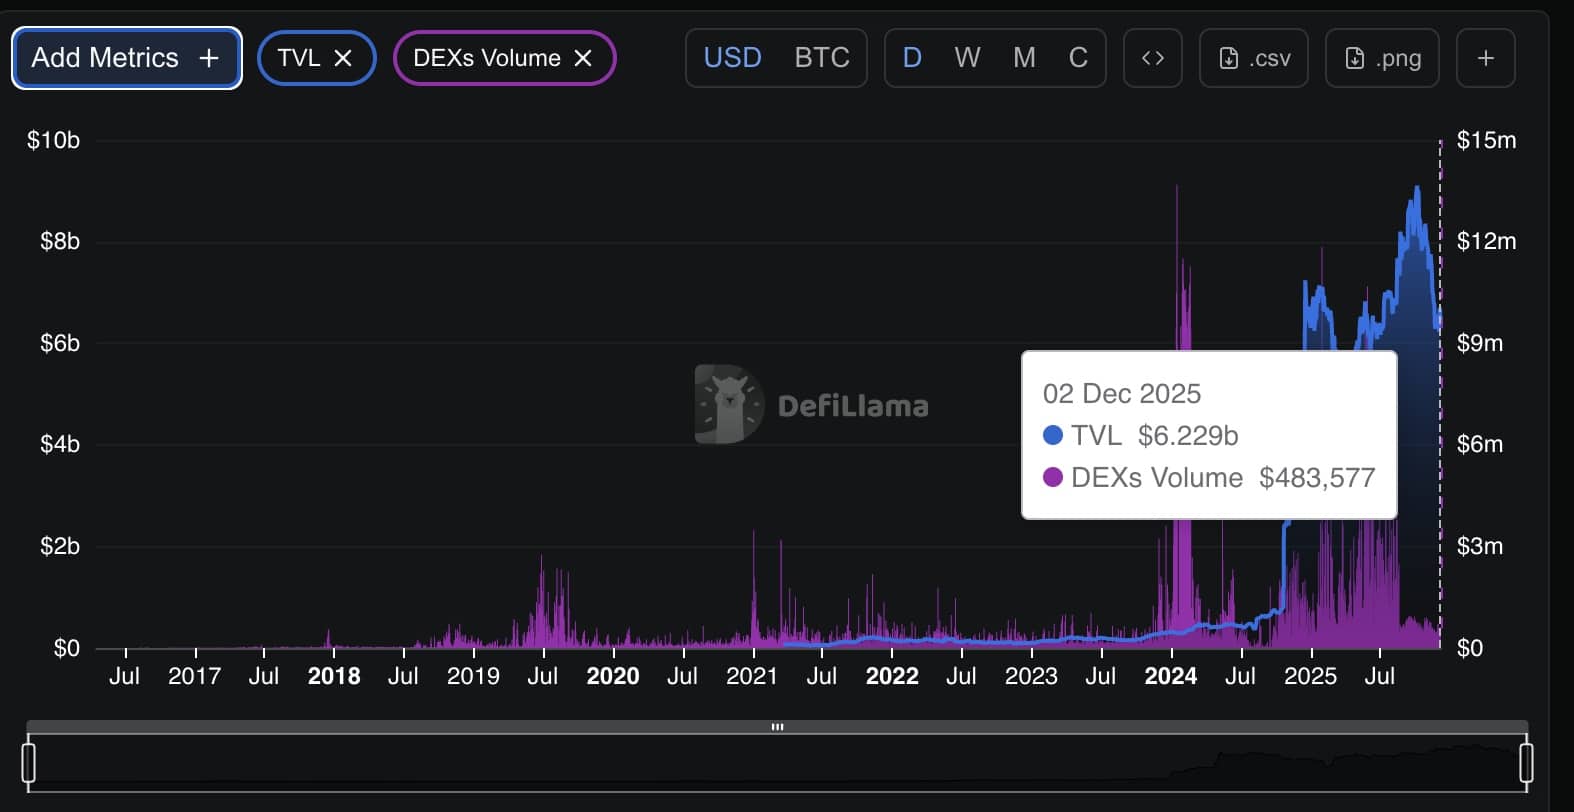
DeFiLlama just under $34M in 24-hour perp DEX volume on the Bitcoin network.
Spot DEX trades add up to about $497,000, and active addresses top 700,000 during the same period.
The Bitcoin network is active, but most of the trading pressure remains in centralized derivatives markets instead of on-chain venues.
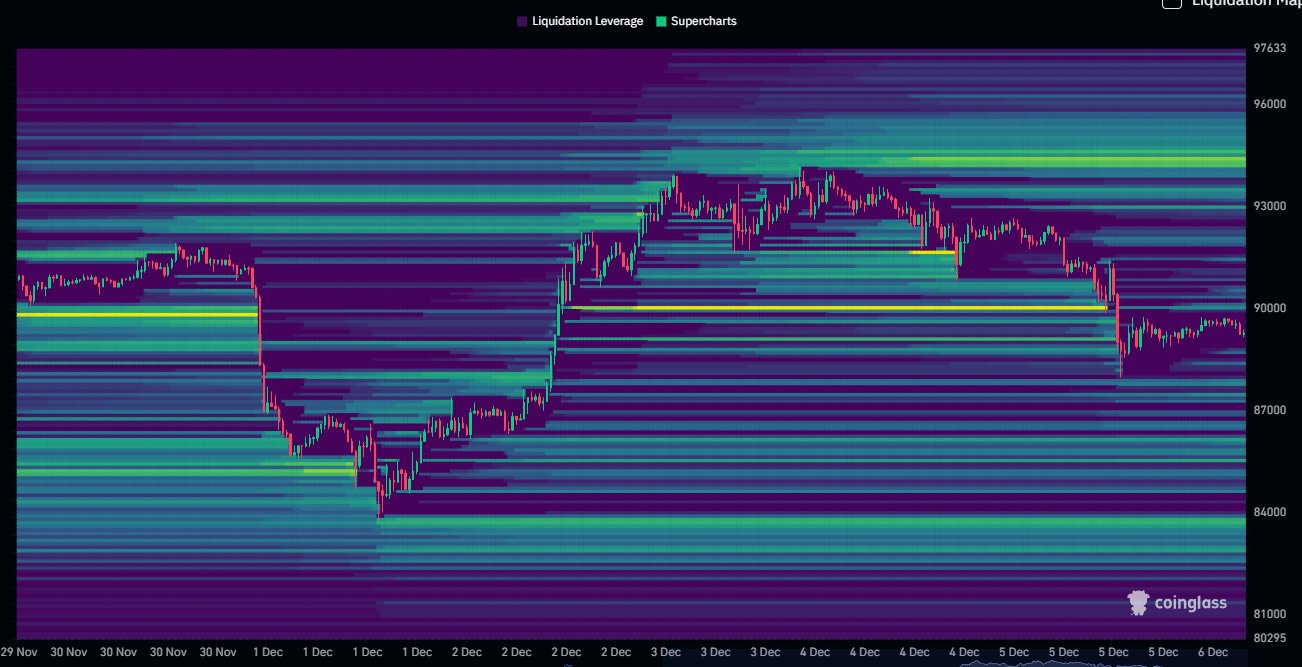
Bitcoin is moving inside a defined liquidity range this week, with traders watching how the price reacts between two major clusters at $84,000 and $94,000.
The chart shared by analyst Daan Crypto heavy liquidation bands on both ends, marking where leveraged positions have built up.
Currently, the price is positioned almost exactly in the middle of this zone, following a sharp drop earlier in the week and a steady rebound.
The upper band around $94,000 has rejected rallies several times. The lower band near $84,000 still retains a significant pool of untouched liquidity.
A move above $94,000 would set a new high and could pull Bitcoin back toward the $100,000 area. But if price slips below $84,000, traders expect a return to the recent local lows.
DISCOVER:
Can ETH USD Price Break the $3,100 Resistance After Weeks of Failed Attempts?
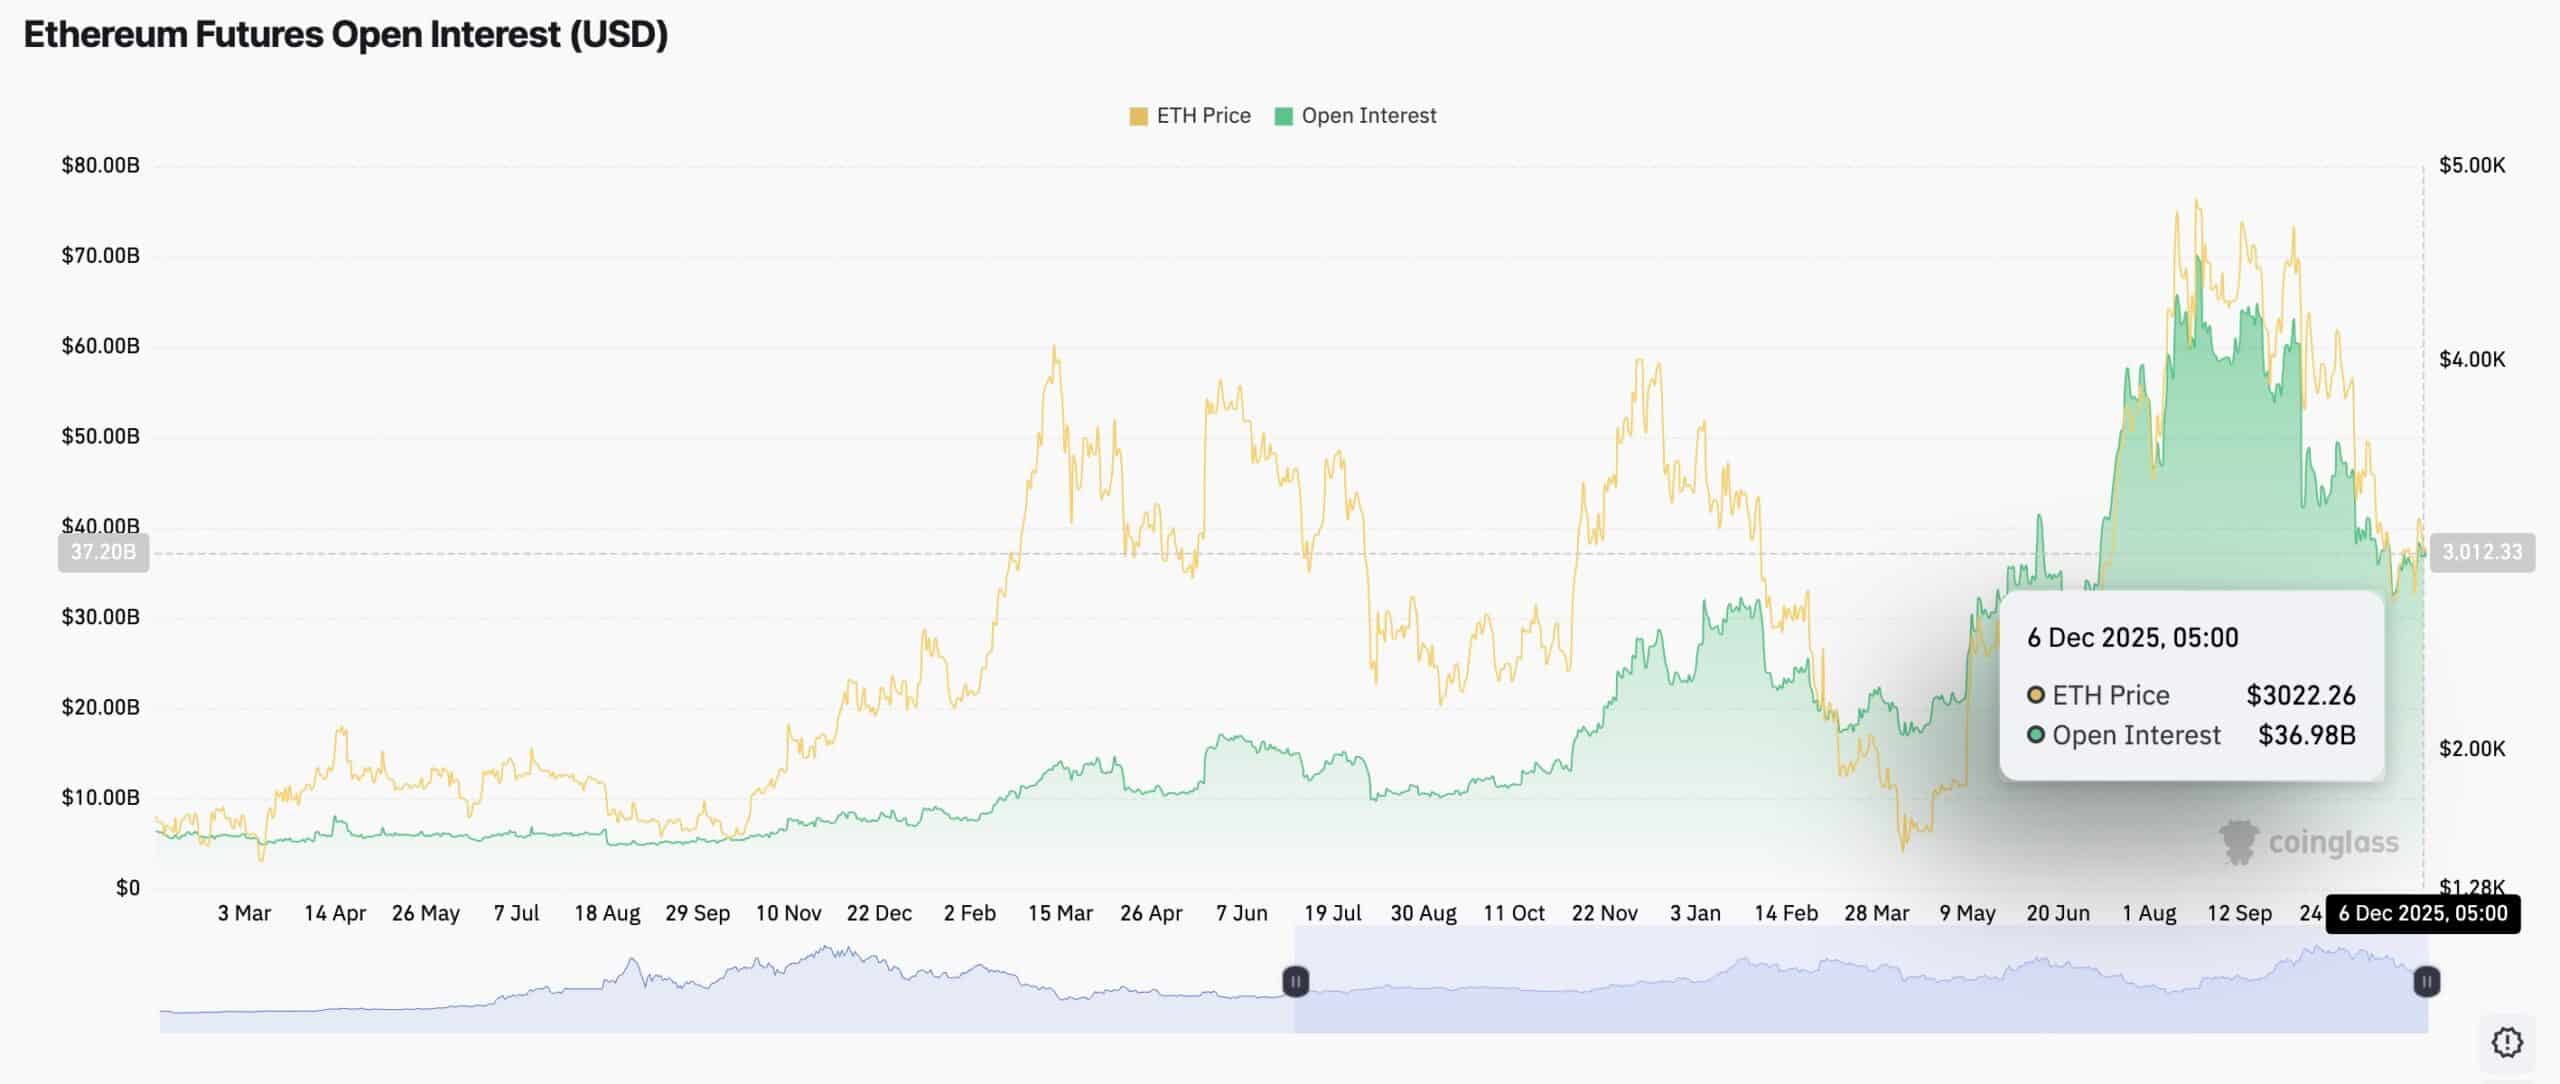
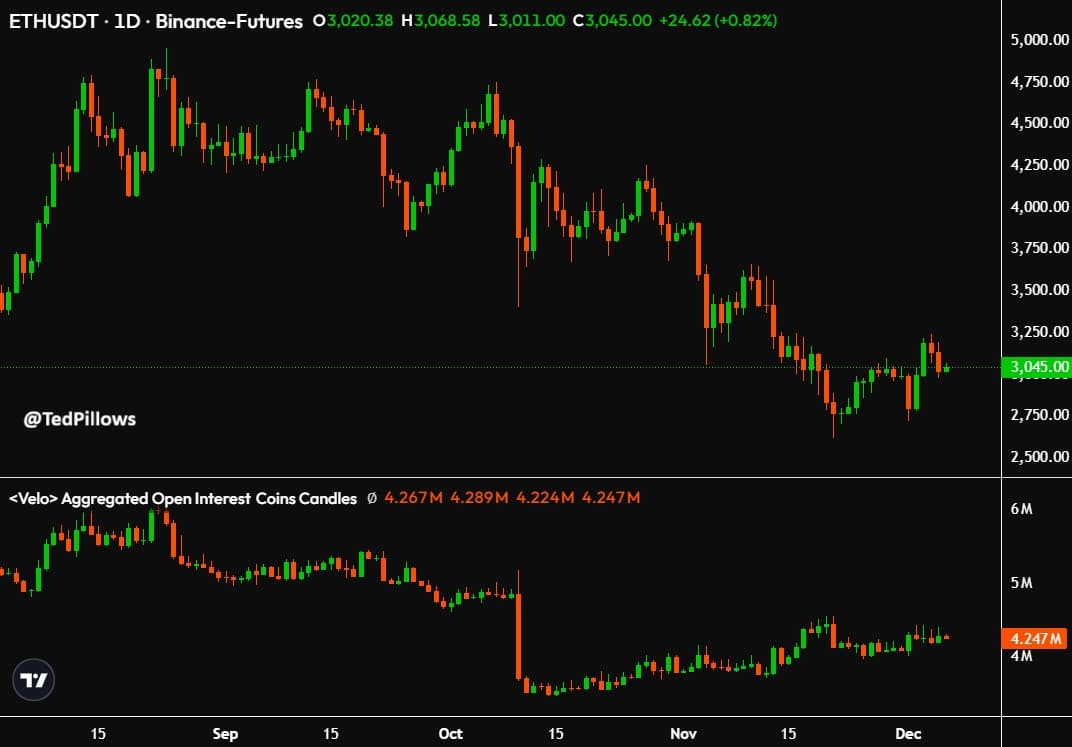
Ethereum’s derivatives market is a slow rise in open interest even as the spot chart keeps moving sideways.
The daily setup reflects a recovery from the mid-October drop, but the price still can’t break past the $3,100 ceiling.
Buyers have attempted to push higher several times, but each effort has been thwarted. That has kept ETH stuck between $2,900 and $3,150.
Momentum is soft, and the candles tell the same story. Wicks on both ends indicate that traders are unsure and are pulling back quickly from intraday moves.
Open interest, however, has been climbing since the October 10 liquidation.
The chart with the analysis shows a move from about 4.2M ETH in mid-October to roughly 4.24M today.
It suggests that traders are slowly adding back leverage, even though the market still lacks direction.
Ted, the analyst who posted the chart, said the recent buildup may not hold. “I think all this will be wiped out in the coming months as MMs will chop Ethereum within a range,” he said.