Bitcoin has held steady around the $108,000 price level in recent days. After bouncing back from a brief pullback near $105,500 on Wednesday, Bitcoin in the past 24 hours.
A popular crypto analyst has shared a long-term “Bitcoin Bull Run Cheat Sheet” that claims that the cryptocurrency the final phase that will lead to massive price gains.
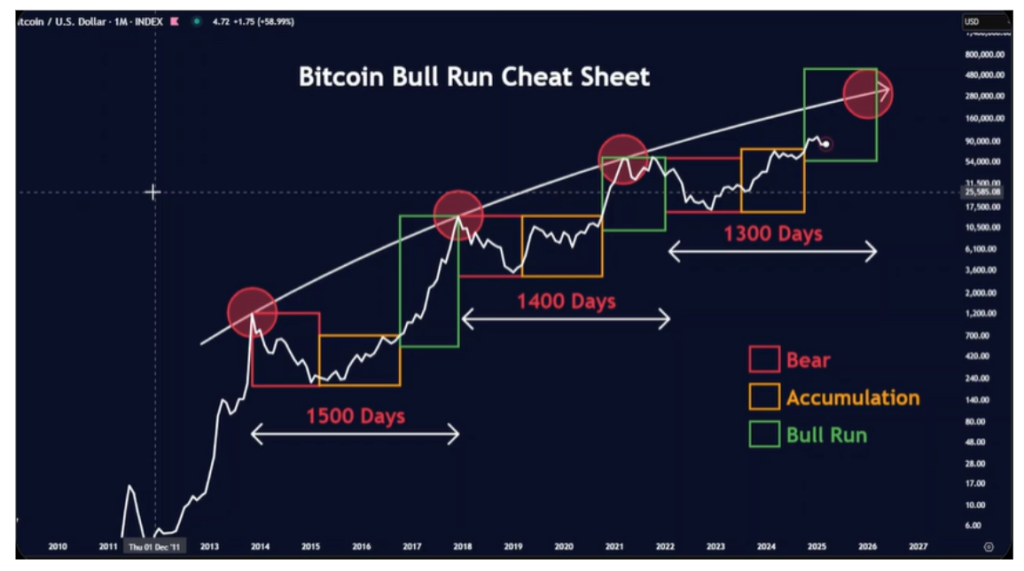
In a recent post on X, Merlijn The Trader the “Bitcoin Bull Run Cheat Sheet.” This cheat sheet is a breakdown of Bitcoin’s past market movements that shows the distinct phases of bear markets, accumulation zones, and subsequent parabolic bull runs.
The cheat sheet divides each of Bitcoin’s two previous cycles from 2014 into three colored boxes: red for bear markets, orange for accumulation, and green for bull runs. Merlijn’s chart traces this repeating structure over the past decade, showing how each bull market followed a similar rhythm that began after a lengthy consolidation period and ended with a strong price explosion.
The with Bitcoin’s peak around $1,000 in December 2013. Following that top, the price entered a long, painful bear market that spanned into 2015. This red-box phase eventually transitioned into accumulation, where Bitcoin traded sideways between $80 and $500 for a prolonged period. The green bull run box on the chart began around early 2017, and eventually ended with a peak just below $20,000 in late 2017. According to the cheat sheet, this entire cycle from peak to new peak lasted 1500 days.
Bitcoin’s second cycle kicked off after its December 2017 top. A long drawdown followed, and the bear market phase dragged Bitcoin down to $3,000 by the end of 2018. The chart marks this point with another red box, followed by the that stretched well into 2020.
The cheat sheet’s green box reappeared in late 2020 right as Bitcoin broke above its previous highs. The price shot up throughout 2021 and eventually reached a new all-time high around $69,000 in November of that year. This second full cycle was shorter than the first and spanned around 1400 days from the previous top.

The current cycle began with Bitcoin’s all-time high in November 2021. Since then, the market has gone through its familiar sequence. A sharp decline into 2022 which bottomed around $15,000 represents the bear market phase. The decline was followed by nearly a year of sideways movement and slow recoveryThis is represented as the orange accumulation box on the cheat sheet above.
According to the analyst, Bitcoin is now in the next bull phase, and . The chart projects a continuation along the long-term growth curve, possibly toward the $250,000 to $300,000 range over the coming year. Notably, the entire cycle this time should take about 1,300 days from late 2021 to complete.
At the time of writing, Bitcoin is trading at $108,260.
Featured image from Pixabay, chart from TradingView