TD9 Setup On Bitcoin Price Chart Suggests It Could Take 4 Years To Reach $149,000 — Details
According to a new analysis shared by crypto analyst Tony “The Bull” Severino, Bitcoin has just closed the quarterly chart with a perfected TD9 sell setup. This is actually interesting, because it adds a possibly long timeline further significant price target.
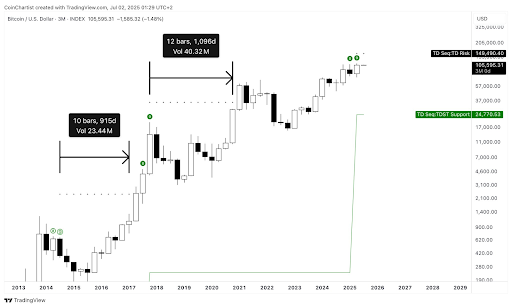
Most of Bitcoin’s daily candles in the past seven days have supported by positive sentiment from various technical analyses. However, , Bitcoin could take up to four years to reach $149,000.
TD9 Setup Hints At Slow Climb To $149,000
The TD9 is a , which is often used to identify trend exhaustion, potential reversals, and possible trend changes. Interestingly, what makes this particular signal notable at this point is that it is now projecting a TD Risk level of $149,490, which is essentially a price target for Bitcoin. But if past patterns on the TD9 indicator are anything to go by, getting there might take much longer than bulls expect.
In 2017, a similar perfected TD9 appeared during Bitcoin’s first rally to $20,000. At the time, the TD Risk was projected at $35,000. It wasn’t until late 2020, roughly four years later, that Bitcoin finally reached and broke above that level. A prior occurrence in 2014 offered the same story.
Back then in 2014, the TD9 setup projected a TD Risk of $2,400, but it took approximately 3.5 years to cross that threshold. Now, , this historical precedent suggests it could take similar years before the $149,490 target being currently projected by the TD Risk is finally tested or breached.
The 3-month candlestick price chart shown above provides a visual analysis of this projection. From the 2014 cycle low, it took 915 days across 10 quarterly candles for Bitcoin to reach its next high. After the 2017 signal, it took 1,096 days (or 12 quarterly candlesticks) for BTC to finally surpass the projected TD Risk level.
Bitcoin Price Action On Gradual Climb
Bitcoin has spent the past seven days in a steady but modest uptrend, rising approximately 1.5% from ato the current range between $109,240 and $109,600. During this move, Bitcoin’s price action tested and retested resistance in the $108,200 to $108,800 zone several times in the past 24 hours. However, it ultimately pushed higher, showing a
At the time of writing, Bitcoin is trading at $109,330, up by 2% in the past 24 hours. It is currently about a 36% move away from reaching the $149,490 price target. However, if Tony Severino’s timeline on the TD9 Risk setup does play out, it wouldn’t be until sometime around July 2029 before Bitcoin reaches the $149,490 price target.