Analyst Predicts Bitcoin Price Crash As War Tensions Mount In Middle East
Bitcoin’s recent price activity has been , particularly following the escalation of tensions. After plunging by nearly 5% amid the rising geopolitical strain, Bitcoin managed to recover, bouncing back above $105,000 and currently trading around $106,800.
The past 24 hours have been highlighted by Bitcoin recovering but with escalating tensions in the Middle East, there’s a good chance it could crash soon. This aligns with an outlook from a crypto analyst, who noted that Bitcoin might crash toward $100,000.
Resistance Band Faces Test For Bitcoin
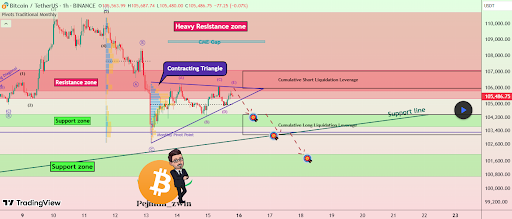
According to crypto analyst Pejman_Zwin on the TradingView platform, Bitcoin and short liquidation zones, stretching from $105,330 to $107,120. This range, he notes, is not only a structural resistance zone but also corresponds with the cumulative short liquidation leverage area.
Basically, this means there’s a high possibility of an intensified price volatility if this zone is challenged or broken. The charts also reveal the presence of a possible contracting triangle pattern, in the context of a larger correction.
According to the analyst, if Bitcoin fails to reclaim $106,600 convincingly, the structure could shift from a corrective triangle to a five-wave downward impulse. This would cause a deeper retracement, especially as the price is already forming lower highs within the triangle. As such, the longer Bitcoin lingers in this resistance range without a breakout, the higher the likelihood of a rapid downward move.
Bearish And Bull Targets
If Bitcoin were to confirm this breakdown, the analyst noted the first major target around the lower boundary of the support zone, which lies between $105,330 and $103,162. This zone is reinforced by the monthly pivot point and also overlaps with the cumulative long liquidation leverage region. The 1-hour candlestick timeframe chart further highlighted a potential short setup from the reversal zone near $107,100 and a projected target close to $104,300.
Further downside could pull the price toward the next support band around $102,600 or even down to $101,000, should liquidation pressure persist. Pejman, on the other hand, pointed out that a sustained breakout above the $107,120 resistance line could initiate a bullish reversal and push Bitcoin back towards the heavy resistance cluster above $108,000. A strong daily close above $108,000 However, failure to break above here could lead to a rejection and another downside move.
Although Bitcoin is its price action is still vulnerable to a quick pullback, especially if the tensions in the Middle East continue to unfold. At the time of writing, Bitcoin is trading at $106,638, down 0.02% in the past 24 hours. This subdued price action shows its current consolidation nature.