Crypto Expert Puts Ethereum Price At $19,500 With Head And Shoulders Emergence
Ethereum reclaimed a significant technical level in the latest 24-hour trading session, with its price and briefly touching $2,870. This interesting cross makes it the first time since February 2025 that Ethereum has traded above the $2,800 threshold. The move comes amid rising bullish momentum flowing out from Bitcoin, and according to recent analysis from a crypto expert, this could be just the for Ethereum.
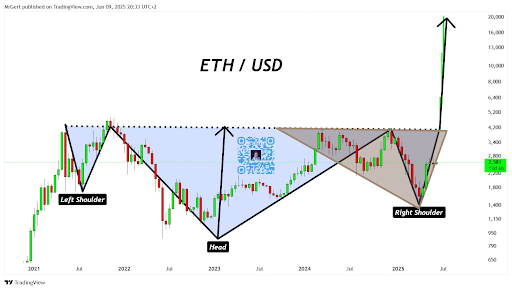
Technical Pattern Says Ethereum Could Be Close To $20,000
An Ethereum has now caught the attention of some traders: a classic inverse Head and Shoulders bottom. According to crypto expert Gert van Lagen, who shared his analysis on the social media platform X, this inverse head and shoulders is setting up on a long-term timeframe.
Specifically, Ethereum’s shared by the analyst, reveals a fully formed structure with a left shoulder in mid-2021, a pronounced head that took shape during the bear market in late 2022 to early 2023, and a right shoulder forming throughout the 2024 correction into early 2025.
The left shoulder emerged in mid-2021, when Ethereum’s price peaked around $4,870, then retraced into the year-end. The head was formed at the lows around $1,350 in 2022 and 2023. The right shoulder is currently in formation after the Ethereum price rebounded from roughly $1,600 in 2025. Finally, this pattern is also highlighted by a symmetry around the neckline drawn near the $4,200 price region.
Keeping this in mind, the neckline of the pattern, which is anchored just below the $4,200 resistance level, is now the most important level to break above. A confirmed breakout above this zone could activate the full bullish target projected by the technical formation.
ETH Price Close To $20,000
According to Gert van Lagen, the two-week head-and-shoulders pattern suggests Ethereum may be “closer to $20K than most anticipate.” His price target calculation follows a classic technical methodology. By measuring the vertical distance from the head’s lowest point to the neckline resistance and then projecting that same distance upward from the neckline, he arrives at a target of approximately $19,500, which is more than a 600% gain
In the same analysis, van Lagen also highlighted a descending broadening wedge pattern that has been forming since mid-2023. This secondary structure reinforces the notion that Ethereum may embark on a significantly larger breakout once $4,200 is cleared.
However, this projection of $19,500 is based on the technical symmetry of the inverse head and shoulders pattern, rather . Additionally, there is no clear timeline for this target; however, based on the multi-year nature of the inverse head and shoulders pattern, the price target may also take up to four years to materialize.
At the time of writing, Ethereum is trading at $2,772, from $2,870.